-
 Blog
Blog
-
 Simulink Support in Teamscale
At CQSE, our mission is to improve the quality of software systems in all domains and across a wide spectrum of technologies. Our latest step towards that goal is the integration of Simulink in Teamscale.
Simulink has been deeply integrated into Teamscale. In addition to being added to our growing list of over 20 supported programming languages, it comes with its own Simulink Viewer in Teamscale, advanced rendering of Simulink blocks and Stateflow models, its own set of metrics, findings and more.
In this post, I present the new features added with the Simulink support in detail, and explain how they can be used.
Teamscale’s Simulink Viewer
Simulink is a block diagram environment developed by MathWorks for multi-domain simulation and model-based design. It is the first graphical programming language to be supported in Teamscale. Thus, it was crucial for us to support the graphical rendering and display of Simulink models. In addition, we wanted to make the models comprehensible in Teamscale for all users, regardless of their level of knowledge or experience with Simulink. Accordingly, we developed our own detailed and functional Simulink Viewer, through which you can easily understand the models, as well as detect any problems in the models right away.
Advanced Rendering of Blocks and Models
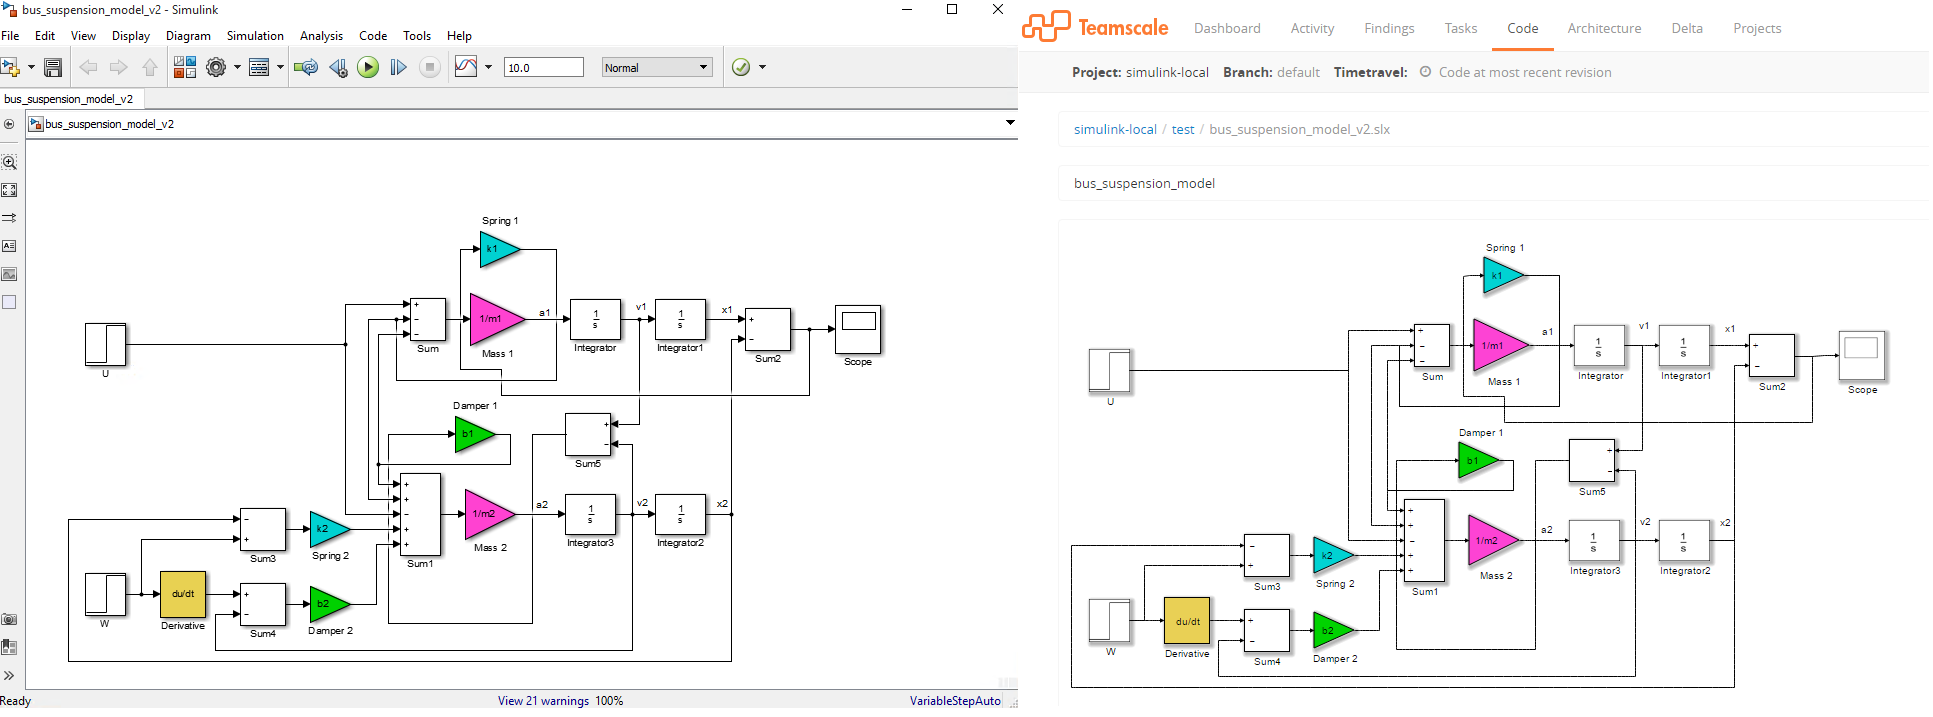
Teamscale’s Simulink Viewer accurately emulates the visual and graphical representation of the Simulink models and blocks in the original Simulink Editor. The screenshot below provides a comparison between how a model is displayed in the Simulink Editor (left), versus how it currently appears in Teamscale (right).

As you can see, Teamscale correctly renders the model in terms of the block sizes, their positions, labels, connections between them, as well as their formatting options (ex. direction, colour, font, etc). As a result, the user is able to easily, and most importantly, correctly understand the displayed model.
Identifying Block Types
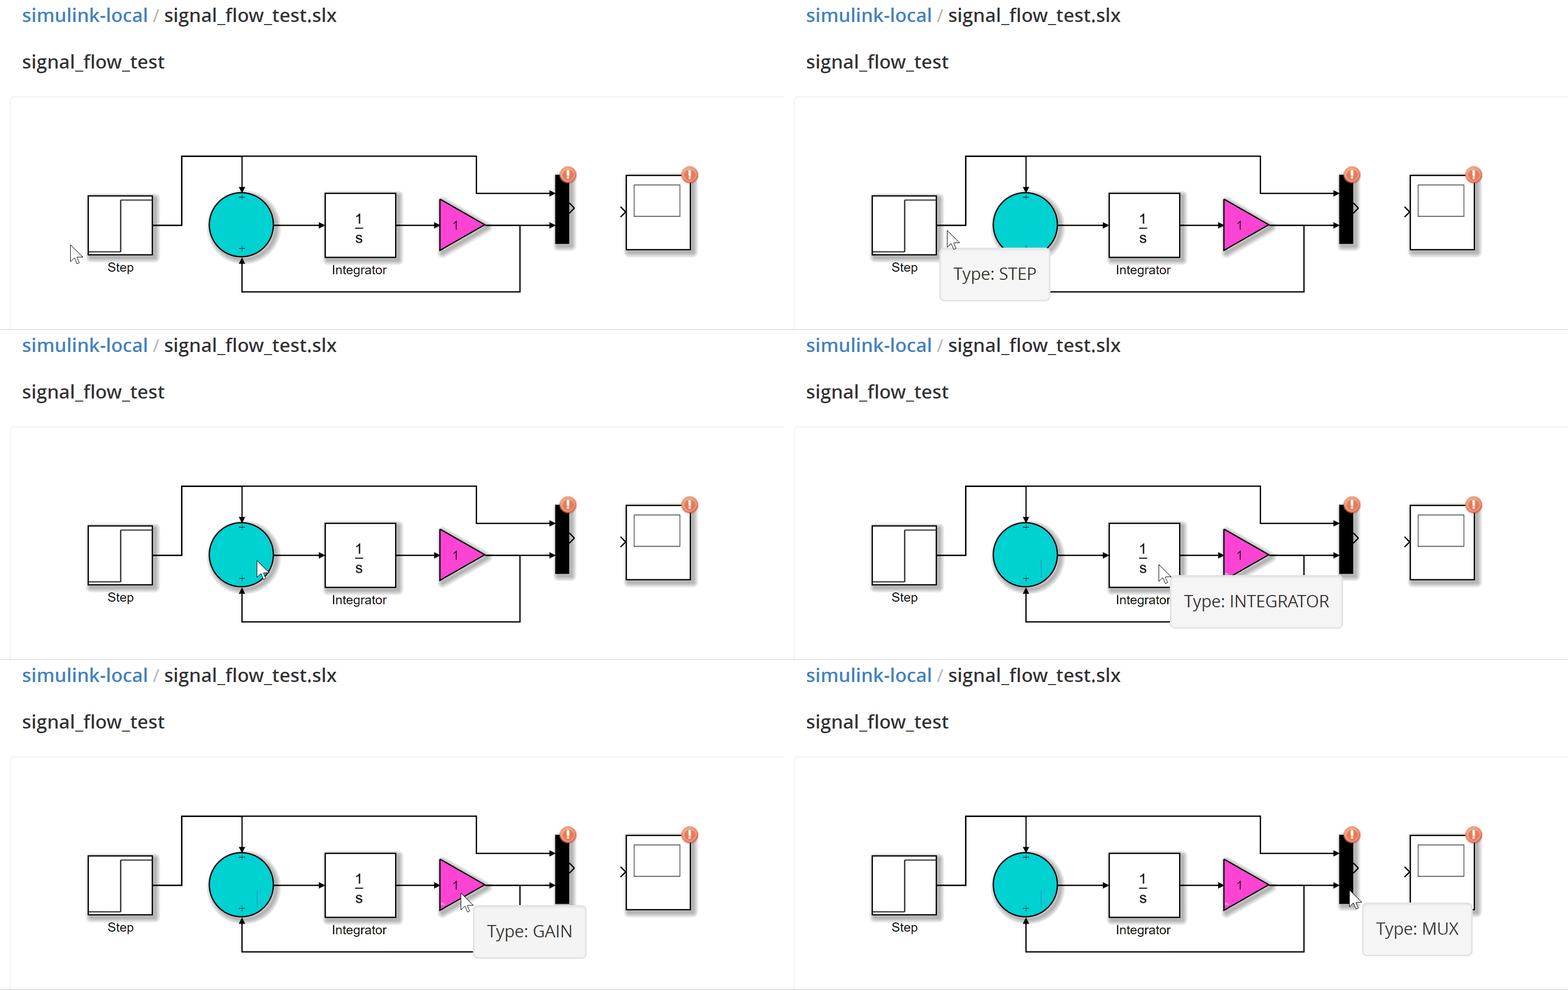
To facilitate and enhance the understanding of Simulink models, the user can conveniently identify the various block types present in a model simply by hovering over it in the Simulink Viewer.

Now, users who have limited Simulink experience or even Simulink developers who simply cannot recall every single block in the Simulink libraries, can readily identify any block in the model, and consequently, better understand the model and its overall purpose.
Navigation along Block References
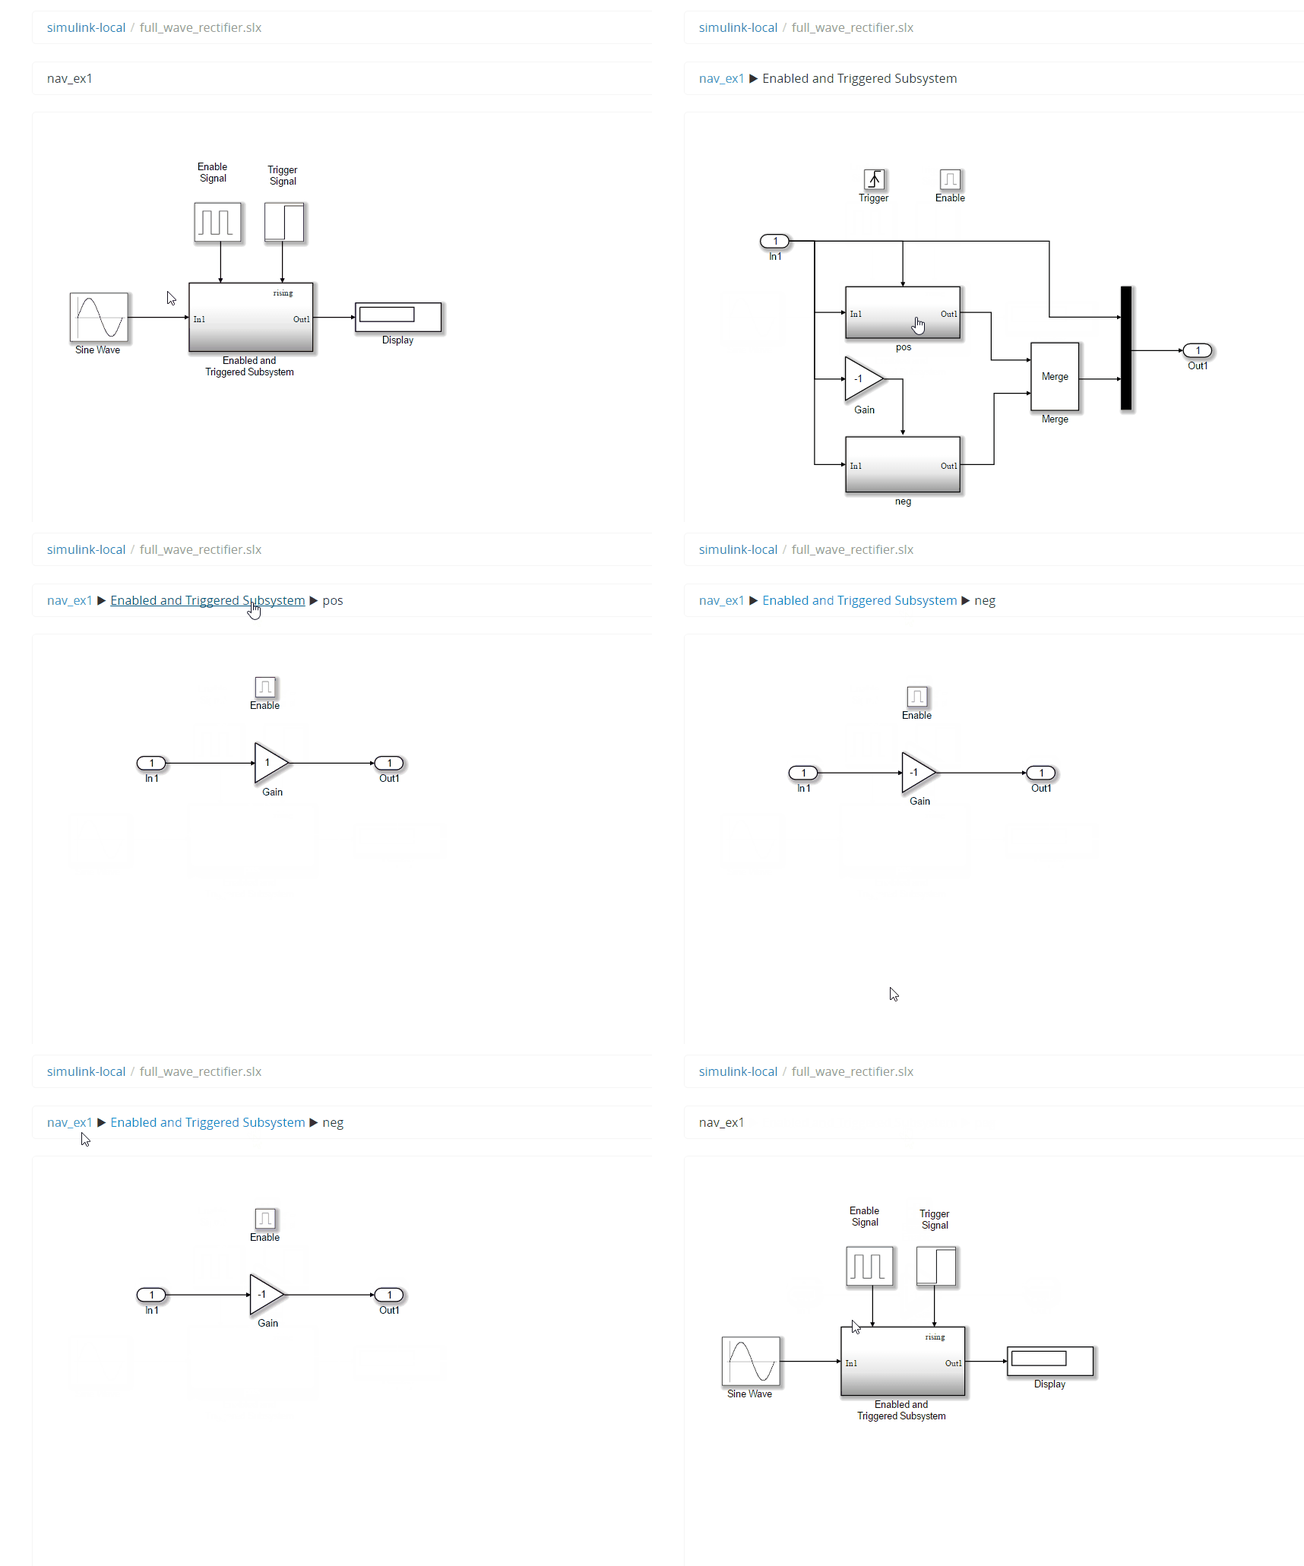
Additionally, Teamscale supports the navigation functionality of the Simulink Editor. As it is depicted in the below gif, the ability to navigate a model’s hierarchy and move along its references and subsystems is also available. This feature enables a deeper understanding of the complete hierarchical tree of the models. Furthermore, it provides the ability to investigate the models in depth and pinpoint the sources of any problems.

Findings and Metrics
Teamscale computes various metrics during the analysis of a project’s source code and detects findings (i.e. quality deficits). Examples of such metrics are lines of code, method length assessment, comment completeness and many more. However, in the case of Simulink, the majority of the available metrics does not apply given Simulink’s graphical nature.
Accordingly, we started to devise a specific set of metrics and findings, tailored for Simulink, to enable proper assessment and evaluation of the models’ state and quality:
- Metrics:
- Block Count: counts the number of blocks in a model.
- State Count: counts the number of Stateflow states in a model.
- Findings:
- Unconnected Port: marks blocks with unconnected ports.
- Unconnected Line: marks lines which are not connected.
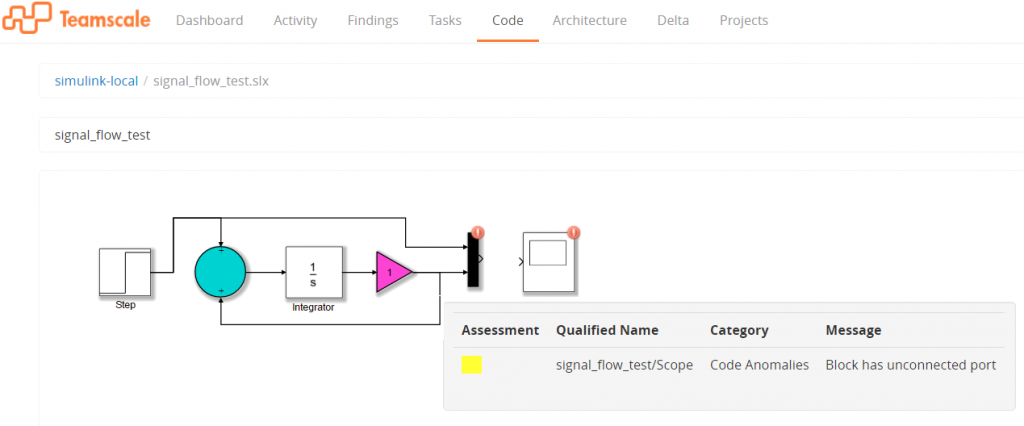
Through these metrics and findings, the Simulink Viewer enables the user to have an overview of the entire model in terms of how many blocks and/or states are included. In addition, you can quickly detect anomalies in unconnected models, as the unconnected ports and/or lines will be visibly and clearly highlighted. The following screenshot shows an example of a finding for a Simulink model, where there are unconnected blocks.

What’s next?
At the moment, the Simulink support is in its initial phases. Our goal, is to continue to build upon the current Simulink analysis profile, and add more metrics and findings for a better overview and assessment of the models’ quality. Additionally, there are more features planned for the upcoming releases such as:
- Linking of Simulink findings from generated code to Simulink models.
- Ability to navigate to Simulink models from generated code comments.
- Mapping code coverage to Simulink models and the visualization of coverage information on the Simulink blocks in the Teamscale Simulink Viewer.
All in all, we are looking forward to the extension and further development of the Simulink support in Teamscale. If you are interested, you can try the features outlined in this post or book a demo today.
If you have any ideas or features you would like to see as a part of this exciting new feature, let me know in the comments below!
Related Posts
Our latest related blog posts.
